Proprietary Signals for TI:CA
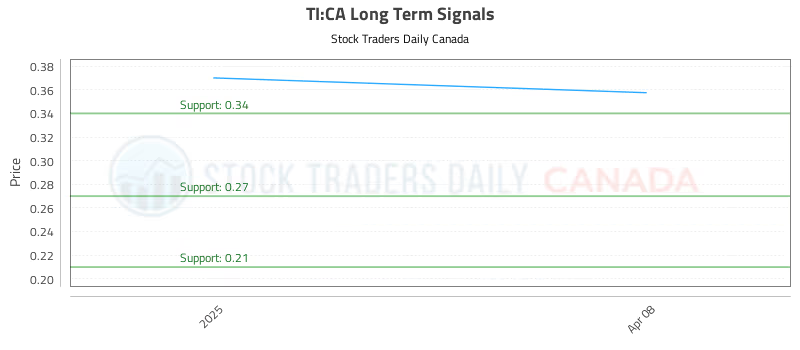
Chart for Titan Mining Corporation (TI:CA)
Blue = Current Price
Red = Resistance
Green = Support
Position Trading StrategyLONG
Entry$0.34
TargetN/A
Stop Loss$0.34
Multi-Timeframe Signal AnalysisSTRONG BIAS
| TIME HORIZON | SIGNAL STRENGTH |
|---|---|
| Near-term | Strong |
| Mid-term | Strong |
| Long-term | Neutral |
Check the time stamp on this data. Updated Proprietary Signals for Titan Mining Corporation (TI:CA) available here (TI:CA stock signals).
Triggers may have already come
Get Real Time Triggers Here.Recent Articles on Titan Mining Corporation (TI:CA)
No recent articles found.